
Link: https://www.mdpi.com/2073-4425/10/10/804/htm
Citation: Genes 2019, 10(10), 804; https://doi.org/10.3390/genes10100804
Masson pine (Pinus massoniana) is a conifer species distributed in 17 provinces, autonomous regions and municipalities located south of the Qinling Mountains in China. It thrives in a warm and humid climate, growing in arid, barren gravel soil and sandy soil. It is also considered as pioneer for reclaiming forests in barren lands which results in restoration of vegetation.
Illumina sequencing for transcriptome analysis:
One year old Masson pine seedlings were obtained for extracting total RNA. Clones with similar heights, uniform growth and strong growth potential were selected as the test materials for reference comparison.
Author used Next Generation sequencing (Denovo) technology to analyze the genome-wide responses of annual seedlings under different durations (0 h, 6 h, 12 h and 24 h) of high CO2 stress.
Transcriptome Assembly and Functional Annotation
In first step sequencing reads were cleaned and transcriptome assembly were generated using Trinity software.
Transcripts corresponding to paralogous genes were sorted out to finally obtain the assembly sequences. TransRate software version was used to filter and optimize the initial assembly sequences obtained from Trinity.
In second step assembled reads were evaluated using BUSCO (Benchmarking Universal Single-Copy Orthologs). Further reads were blasted/compared in KEGG public database to trace pathway analysis.
Differential Gene Expression analysis was performed using RSEM and EdgeR softwares to visualize most abundant expressed genes which were visualized from plots and heatmaps.
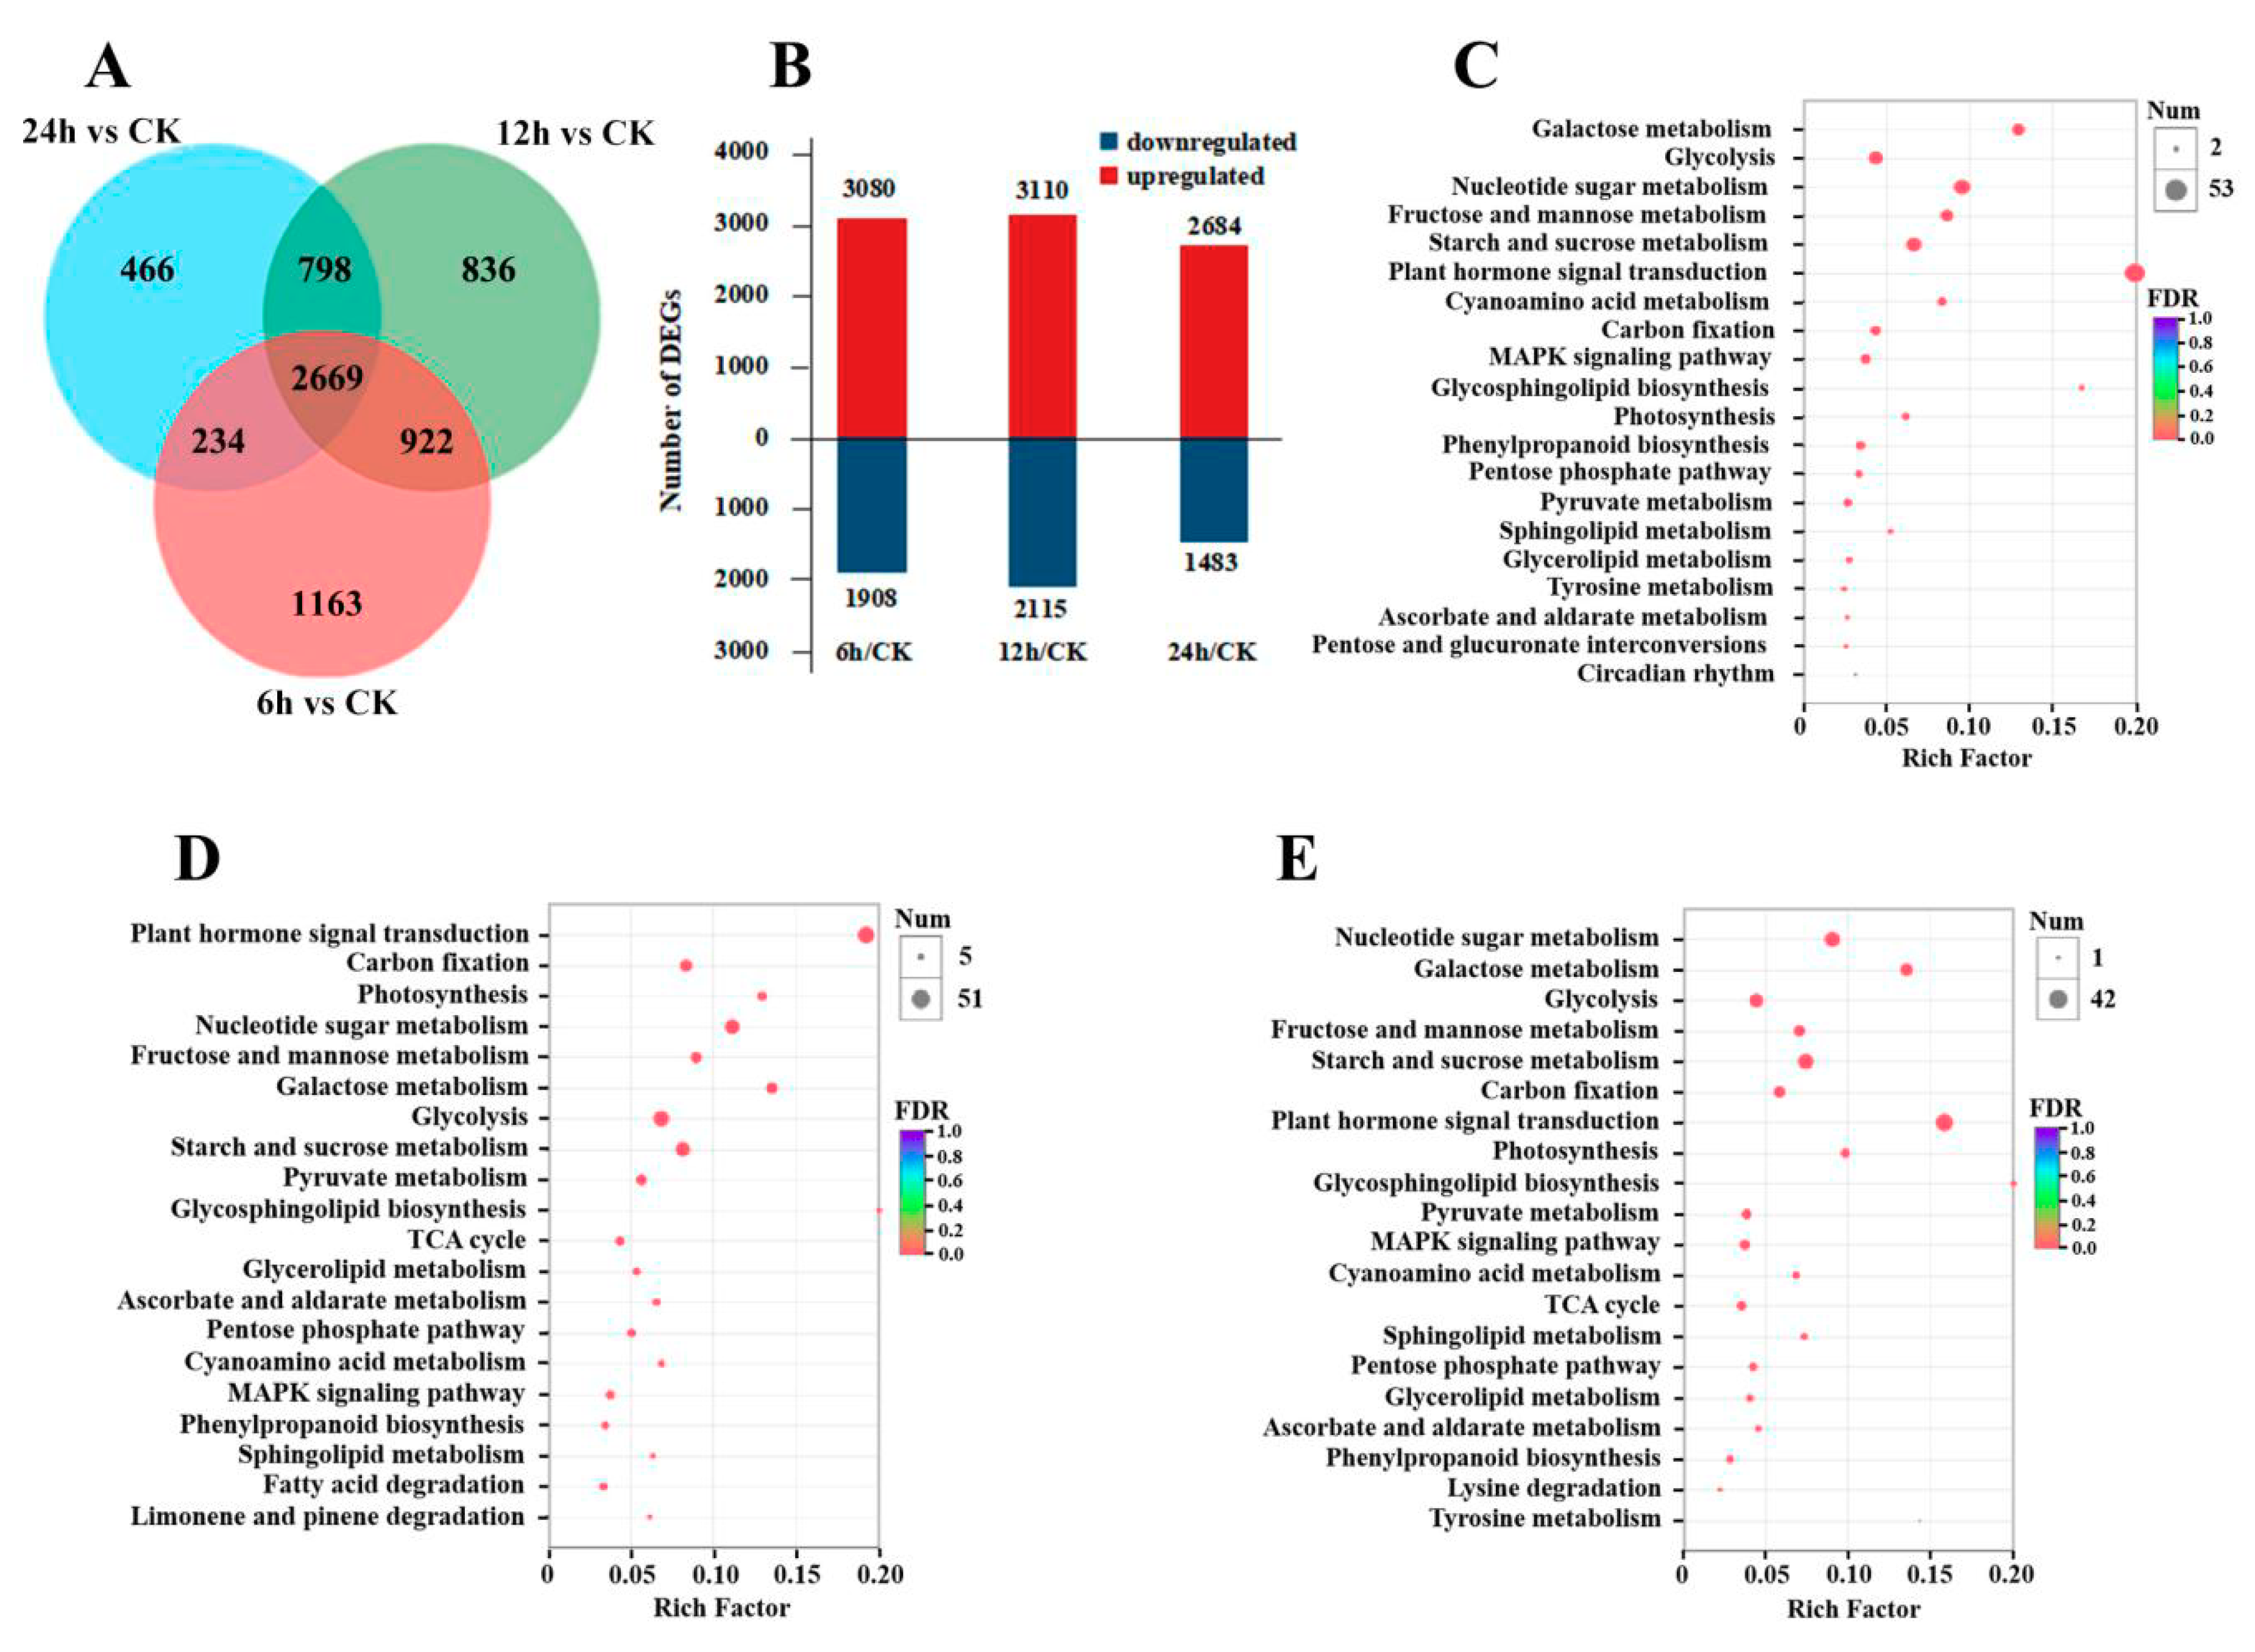
Differential gene expression in seedlings under high CO2stress.
(A) Venn diagram of differentially expressed genes.
(B) Statistical map of differentially expressed genes between different comparisons. Red and blue represent up- and down-regulated expression, respectively.
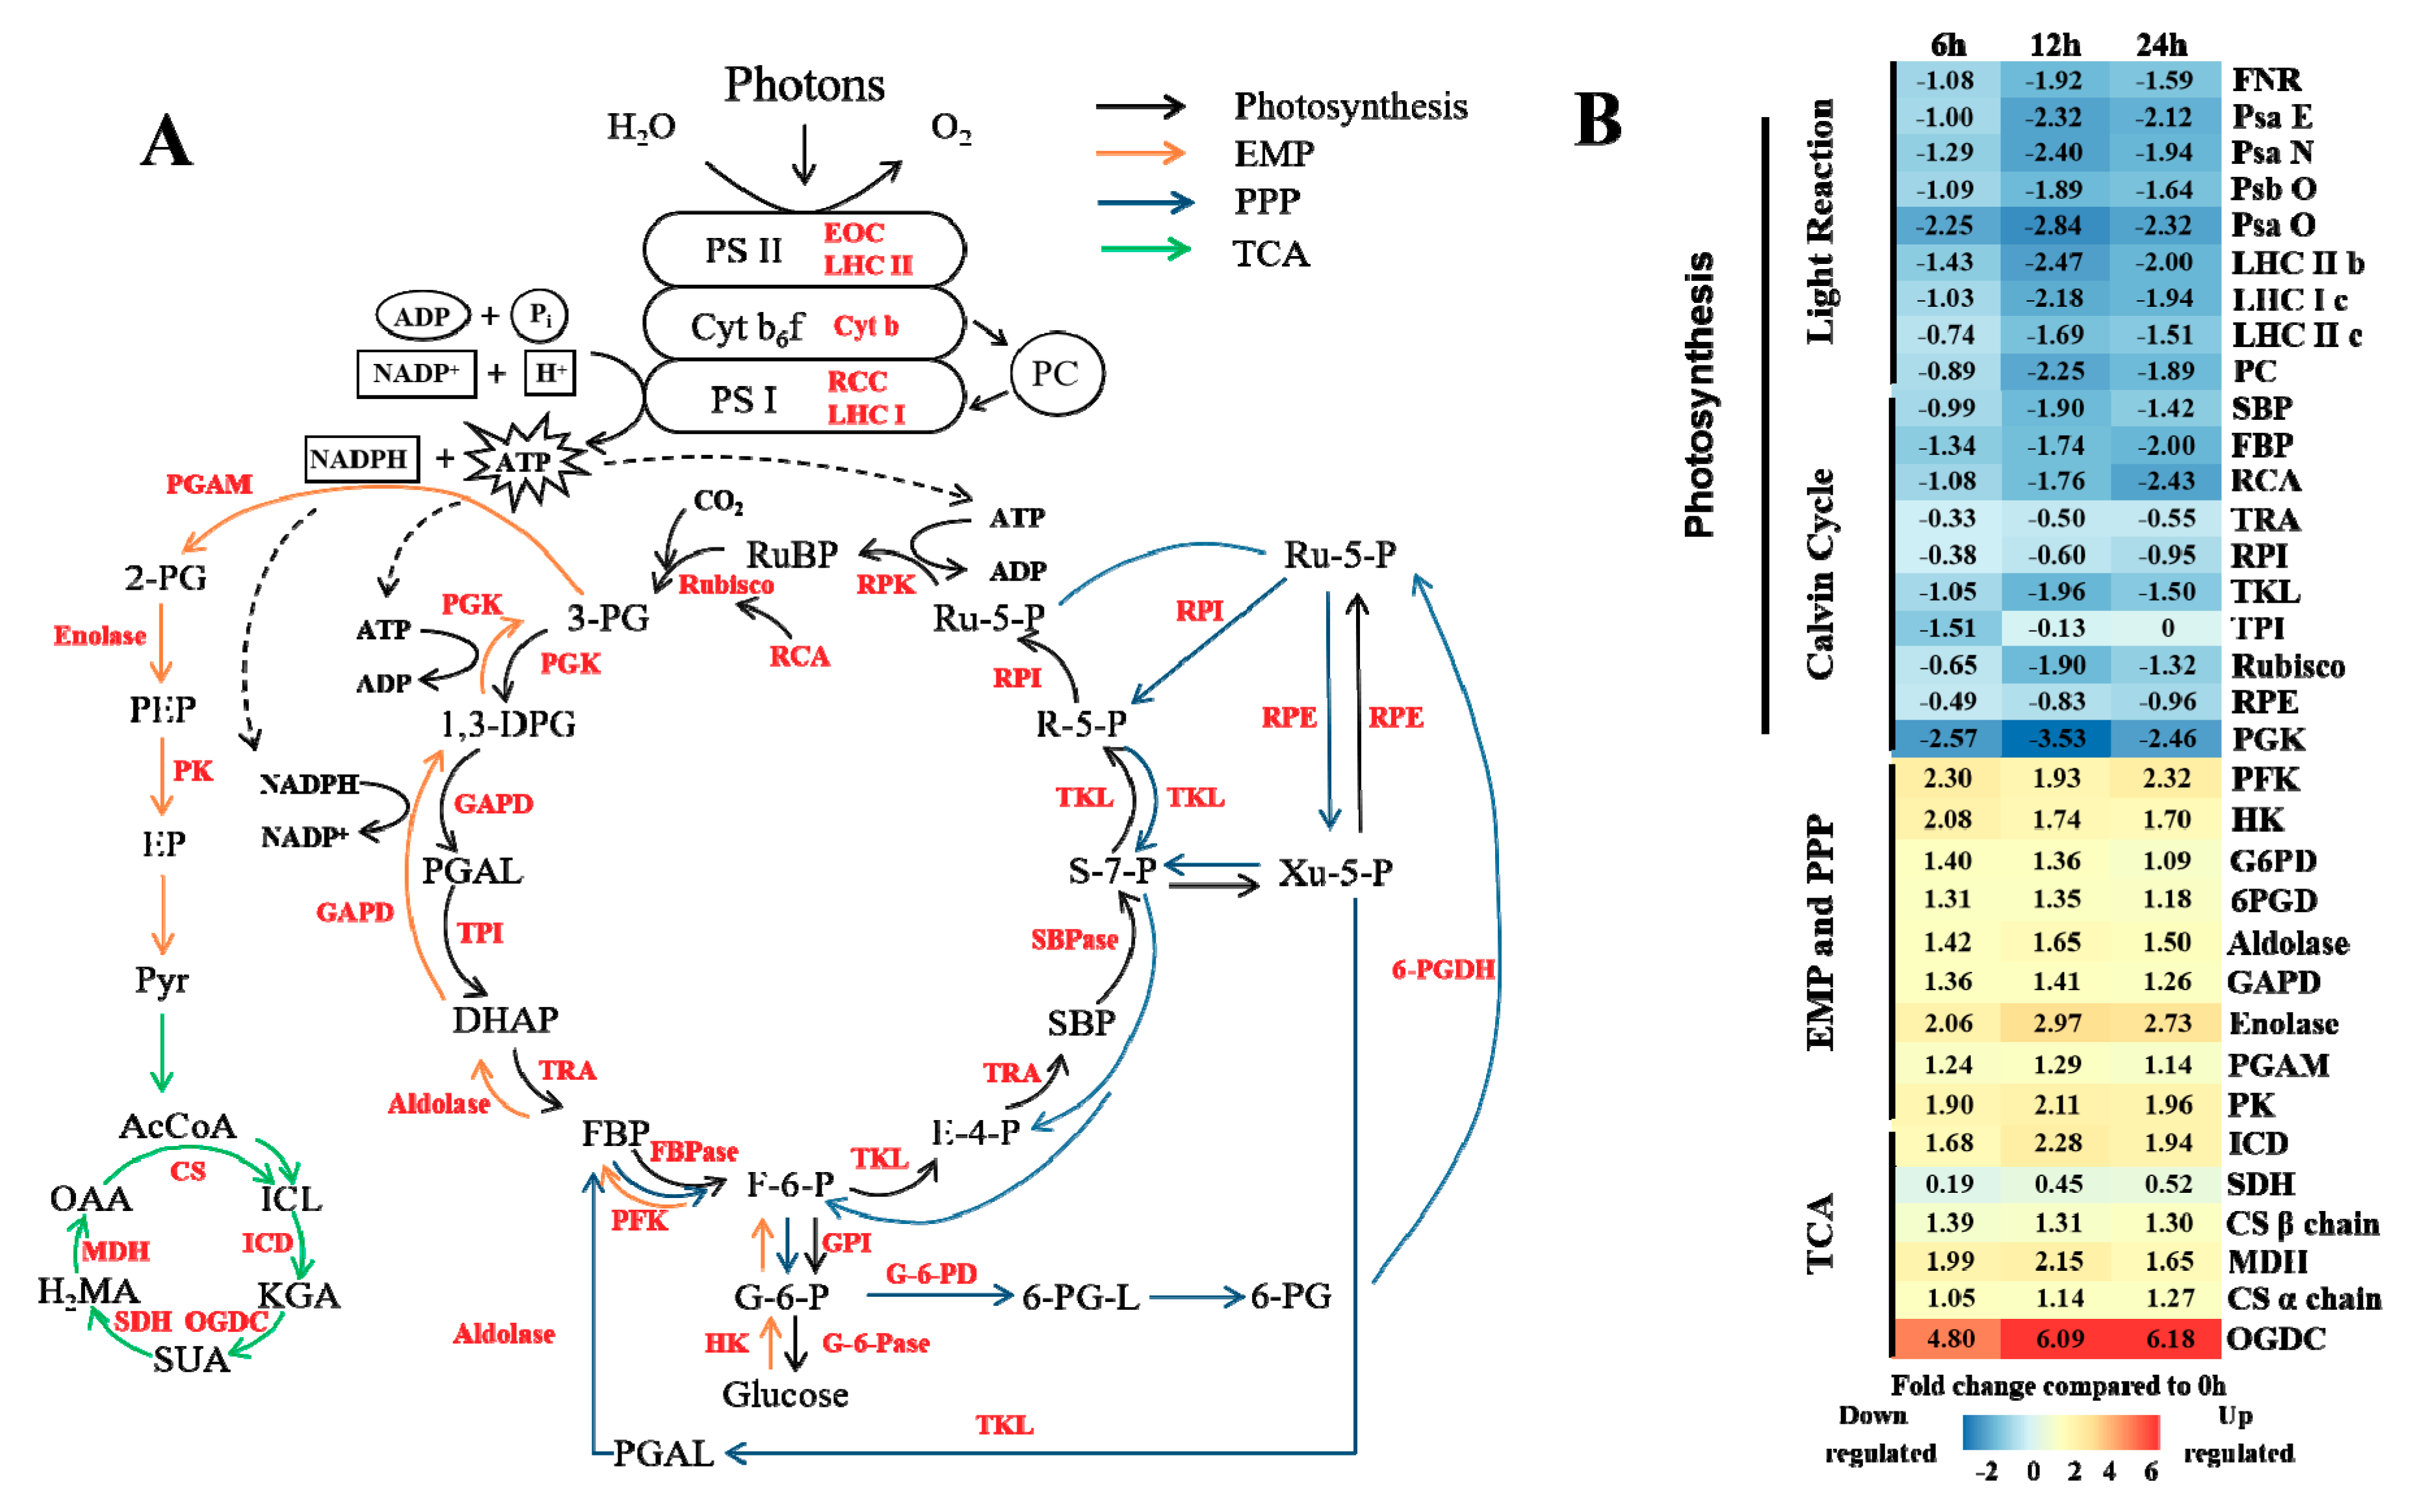
Influence of high CO2 concentration on energy metabolism.
(A) The main energy pathways in plants. Black, orange, blue and green arrows represent photosynthesis, the Embden-Meyerhof-Parnas (EMP) pathway, the pentose phosphate (PPP) pathway and the tricarboxylic acid (TCA) cycle, respectively.
(B) Expression changes in the genes involved in metabolic pathways in response to stress. White indicates no change, red up-regulation, and blue down-regulation in each treatment, as shown in the color bar for a log2 fold change scale.
In this study, a next-generation transcriptome sequencing analysis of Masson pine under high CO2 stress was evaluated using the Illumina next generation sequencing and differential gene expression analysis.
The transcriptome results were used to identify genes that might be involved in the response to CO2 and to clarify the possible molecular mechanisms involved in the adaptation to CO2 stress.
If you are interested to get your transcriptome data analyzed or need to need help with transcriptome projects, contact us for a no obligation consultation at sales@1010genome.com or fill up the form below to provide us some details and one of our expert will contact you.